Location
States
OklahomaIntroduction
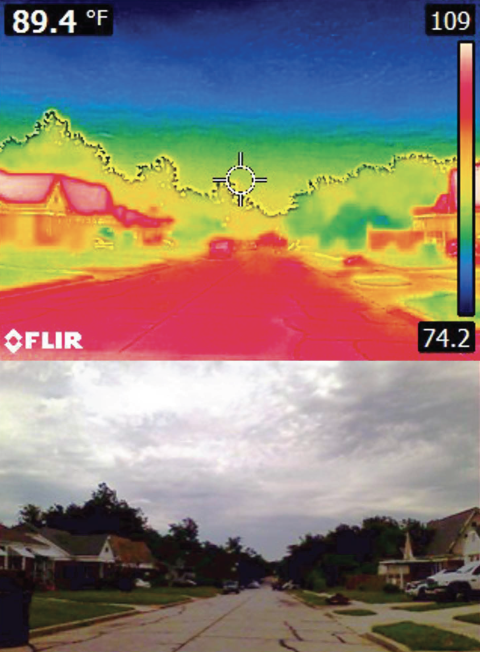
Urban Heat Islands (UHIs) are urban areas that are warmer than surrounding rural areas, largely due to differences in land cover. Within UHIs, temperatures can vary greatly depending on nearby environmental features. For example, areas with dark pavement and few trees can be up to 20 degrees Fahrenheit warmer than well-shaded neighborhoods (NOAA).
As our climate continues to change, scientists expect an increase in the intensity and frequency of extreme heat events, amplifying the effects of UHIs. Extreme heat is especially dangerous for those with pre-existing health conditions, the elderly, and low-income households who struggle to afford the high energy costs associated with air conditioning (Shandas et al., 2017). Poor air quality is another urban phenomenon that poses a threat to human health. Air pollution tends to increase in response to high energy demand during extreme heat events, and warm temperatures promote the formation of ground-level ozone, which can cause respiratory issues. While cities are aware of these hazards, it has been difficult to take meaningful action without measurements of temperature and air quality taken near the earth’s surface at neighborhood-scale.
To address the issue of extreme heat, federal partners created the National Integrated Heat Health Information System (NIHHIS), a division of the National Oceanic and Atmospheric Administration (NOAA). NIHHIS supports actionable science to reduce heat-related illness and death and support equitable heat resilience. Starting in 2017, NIHHIS began funding Climate Adaptation Planning + Analytics (CAPA) Strategies to support more than 70 UHI mapping campaigns. CAPA provides program and training materials, equipment, and analysis to participating communities. Because of its demonstrated need and desire to implement equitable heat mitigation strategies, Oklahoma City was one of 18 communities selected to participate in a 2023 NIHHIS-CAPA UHI mapping campaign. With guidance from CAPA, the Oklahoma City Office of Sustainability designed a city-wide campaign to capture temperature and air quality data. On August 12, 2023, citizen scientists attached sensors to their vehicles and followed a set route during one of three shifts. CAPA processed the data and produced a report with maps to help users identify hotspots within the study area and inform public and environmental policy.
Key Issues Addressed
Quantifying temperature variability within urban areas is difficult. Surface temperatures are not representative of the ambient air temperatures residents experience, and satellites cannot capture the evolution of UHIs throughout a day. Satellites measure surface temperatures at 100-meter resolution every 16 days, which does not sufficiently represent UHIs. Additionally, a variety of land cover types can exist within a single satellite grid cell, so what we see is essentially an average for the whole area. Cities need maps with greater spatial and temporal resolution to better understand how different neighborhoods experience heat throughout a summer. A lack of representative temperature data also leads to less meaningful conversations about extreme heat with policymakers and the public. Education efforts and policy changes are necessary to mitigate the impacts of extreme heat.
Climate change increases the threat of urban heat. By mid-century (2036-2065), the South Central Climate Adaptation Science Center projects that Central Oklahoma will experience approximately double the number of days with highs over 100 degrees and three additional heat wave events each year (SC CASC, 2020). Despite the increased threat of urban heat, Oklahoma City lacks a coordinated network of local agencies and individuals focused on heat and heat mitigation.
Based on air quality measurements taken between 2018 and 2020, the Oklahoma City Metropolitan Statistical area nearly exceeded the National Ambient Air Quality Standards for ozone set by the Environmental Protection Agency (EPA). Cities that exceed standards for ozone or the other five criteria pollutants (particulate matter, nitrogen oxides, carbon monoxide, sulfur dioxide, and lead) are designated as nonattainment areas. Nonattainment areas face increased regulation that can curtail economic growth and slow transportation projects. Hot temperatures associated with UHIs can lead to poor air quality. Electricity demand increases during extreme heat events, resulting in more pollutant and greenhouse gas emissions. Pollutants become more reactive in sunny and hot conditions, accelerating the formation of ground-level ozone.
Project Goals
- Quantify temperature variability across 350 square miles of Oklahoma City
- Identify areas of greatest need for heat mitigation strategies
- Increase understanding of air quality issues across Oklahoma City
- Produce meaningful representations of urban heat for policymakers and the public
- Bring together local agencies and individuals to create a network focused on heat and heat mitigation
- Initiate a heat mitigation action plan
Project Highlights
Visualizing the Urban Heat Island: Partner organizations used drones and thermal cameras to compare the heating effect of neighborhoods, city parks, and dark pavement.
- Setting a Date: The Oklahoma City Office of Sustainability relied on historical records of daily maximum air temperature and total precipitation to select their proposed campaign date of August 12, 2023. In the weeks leading up to the campaign, the National Weather Service issued a tailored forecast designed to help organizers decide whether to proceed with this date. The forecast predicted that the proposed date would meet the 90th percentile temperature threshold, prompting organizers to confirm the campaign date.
- Campaign Execution: The organizers recruited a diverse group of citizen scientists through local news outlets, universities, and other organizations. Individuals attended one of three pre-campaign training sessions where they learned about their role in the data collection process. On August 12, 2023, 252 citizen scientists attached sensors to their team’s vehicle and collected temperature, humidity, and air quality data at 263 points of interest over the 350-square-mile study area. The campaign consisted of three shifts, one in the morning, afternoon, and evening. Each shift was supported by 33 volunteer teams.
- Education Efforts: Prior to the campaign, organizers from Oklahoma City’s Office of Sustainability collaborated with University of Oklahoma researchers to share heat safety tips, cooling techniques, and energy-saving practices at a public workshop. Besides being integral to the mapping efforts, volunteers learned about extreme heat through their participation. During a pre-campaign training session, volunteers learned what a UHI is and how environmental characteristics can influence temperatures across a city.
- Data Analysis and Distribution: Following the campaign date, Climate Adaptation Planning + Analytics (CAPA) Strategies compiled and cleaned the data. In addition to the temperature data collected by volunteers, CAPA incorporated land cover data into their machine learning model to produce high-resolution maps of ambient air temperatures, heat indices, and air quality across the study area. The maps present temperature data across Oklahoma City using a diverging red-blue color scale, and viewers can easily identify warmer (red) and cooler (blue) areas in the city. CAPA developed a summary report including the urban heat and air quality maps and explanations of methods that can be shared with policymakers and the public.
Lessons Learned
Oklahoma City’s campaign was one of the largest NIHHIS-CAPA UHI mapping campaigns to date, both by study area and number of volunteers. On-the-ground support from local partner organizations was essential to a successful and safe campaign in Oklahoma City. The Oklahoma Department of Environmental Quality funded the campaign’s 20 air quality sensors to measure particulate matter. Staff from the Association of Central Oklahoma Governments (ACOG) prepared and distributed the equipment to volunteers, and the University of Oklahoma Institute for Resilient Energy and Environmental Systems contributed snacks, drinks, and sunscreen. Throughout the day, Medical Reserve Corp volunteers were prepared to treat heat-related illnesses. Without the help of citizen scientists, such a large area could not have been covered three times in one day.
Because volunteer participation was critical for campaign success, preparing volunteers, assigning routes, and facilitating group communications was time-intensive. An automated volunteer onboarding process could have reduced the time devoted to administrative tasks and increased the organizers’ capacity to conduct outreach in vulnerable neighborhoods and enhance volunteers’ experience at equipment distribution locations.
NIHHIS-CAPA UHI mapping campaigns ideally take place on or around the hottest day of the year to capture the extent of urban heat. Unfortunately, unexpected and persistent rain showers during the afternoon and evening shifts of Oklahoma City’s campaign kept temperatures lower than expected. Nevertheless, the campaign provided hundreds of thousands of air quality and air temperature measurements that will help officials identify areas of the city that are most impacted by extreme heat.
Organizers learned the mobile sensors fit some vehicles better than others. The sensors could be modified in future campaigns to more securely attach to windows. Additionally, it would have been beneficial to have stationary air quality monitors in place before, during, and after the mobile campaign. Organizers recognize interest generated by the campaign could be used to support ongoing monitoring efforts like PurpleAir.
Next Steps
- Use data to inform updates for adaptokc, Oklahoma City's first sustainability plan.
- Promote CAPA’s summary report as empirical evidence for temperature and air quality hotspots to raise awareness of urban heat issues.
- Develop an Intervention Guidebook, a heat mitigation action plan, that includes a Heat Perception Survey using funding from the Oklahoma City Community Foundation and ACOG and analyze existing heat mitigation policies.
- Create cost estimates for implementing recommended policies from the Intervention Guidebook that offer short- and medium-term improvements to UHIs. Draft government obligation bonds to fund these projects or explore other funding sources, such as public-private partnerships and federal grants.
Funding Partners
- National Oceanic and Atmospheric Administration
- City of Oklahoma City
- Oklahoma Department of Environmental Quality
- Association of Central Oklahoma Governments
- Oklahoma City Community Foundation
Resources
- Basera et al. (2010). “The Impact of the Urban Heat Island during an Intense Heat Wave in Oklahoma City.” Advances in Meteorology 2010: 1-10.
- Shandas et al. (2019). “Integrating Satellite and Ground Measurements for Predicting Locations of Extreme Urban Heat.” Climate 7(1): 5.
- Voelkel, Jackson, and Vivek Shandas (2017). “Towards Systematic Prediction of Urban Heat Islands: Grounding Measurements, Assessing Modeling Techniques.” Climate 5(2): 41.
- Dixon, K.W., et al. A.M. Wootten, M.J. Nath, J. Lanzante, D.J. Adams-Smith, C.E. Whitlock, C.F. Gaitán, R.A. McPherson, (2020).: South Central Climate Projections Evaluation Project (C-PrEP), South Central Climate Adaptation Science Center, Norman, Oklahoma, USA. DOI: https://doi.org/10.21429/12gk-dh47
- OKC-CAPA Strategies, LLC Memorandum of Understanding
- Oklahoma City selected for urban heat mapping campaign assistance
- Cost of Nonattainment Study for the Oklahoma City Area
- Ozone Air Quality Standards
- https://www.heat.gov
- Seminar with Vivek Shandas, advisor to CAPA Strategies
- adaptokc
- planokc
- Heat Island Impacts | US EPA
- University of Oklahoma College of Atmospheric & Geographic Sciences
- University of Oklahoma Gibbs College of Architecture
- University of Oklahoma Hudson College of Public Health
Contacts
- T.O. Bowman, Oklahoma City Office of Sustainability: to.bowman@okc.gov
- Sarah Terry-Cobo, Oklahoma City Office of Sustainability: sarah.terrycobo@okc.gov
CART Lead Author
Jack Carter, CART Student Writer, University of Oklahoma
Suggested Citation
Carter, J., B. (2023). “Mapping the Urban Heat Island in Oklahoma City.” CART. Retrieved from https://www.fws.gov/project/mapping-urban-heat-island-oklahoma-city


